

Lets-Plot is a multiplatform plotting library built on the principles of the Grammar of Graphics.
The library design is heavily influenced by Leland Wilkinson's work The Grammar of Graphics describing the deep features that underlie all statistical graphics.
This grammar [...] is made up of a set of independent components that can be composed in many different ways. This makes [it] very powerful because you are not limited to a set of pre-specified graphics, but you can create new graphics that are precisely tailored for your problem.
- Hadley Wickham, "ggplot2: Elegant Graphics for Data Analysis"
A bridge between R (ggplot2) and Python data visualization.
To learn more, see the documentation site at lets-plot.org/python.

Create plots in Kotlin Notebook,
Datalore, Jupyter with Kotlin Kernel
or any other notebook that supports Kotlin Kernel.
To learn more, see the Lets-Plot Kotlin API project at GitHub.
Embed Lets-Plot charts in Compose Multiplatform applications.
To learn more, see the Lets-Plot Compose Frontend project at GitHub.
Embed Lets-Plot charts in JVM (Swing, JavaFX) and Kotlin/JS applications.
To learn more, see the Lets-Plot Kotlin API project at GitHub.
Kotlin API documentation site: lets-plot.org/kotlin.


Scientific mode in PyCharm and in IntelliJ IDEA provides support for interactive scientific computing and data visualization.
Lets-Plot in SciView plugin adds support for interactive plotting to IntelliJ-based IDEs with the Scientific mode enabled.
Note: The Scientific mode is NOT available in communinty editions of JetBrains IDEs.
Also read:
-
Statistical Summaries Directly on
geom_smooth()Plot LayerThe
geom_smooth()layer now includes alabelsparameter designed to display statistical summaries of the fitted model directly on the plot.
This parameter accepts asmooth_labels()object, which provides access to model-specific variables like$R^2$ and the regression equation.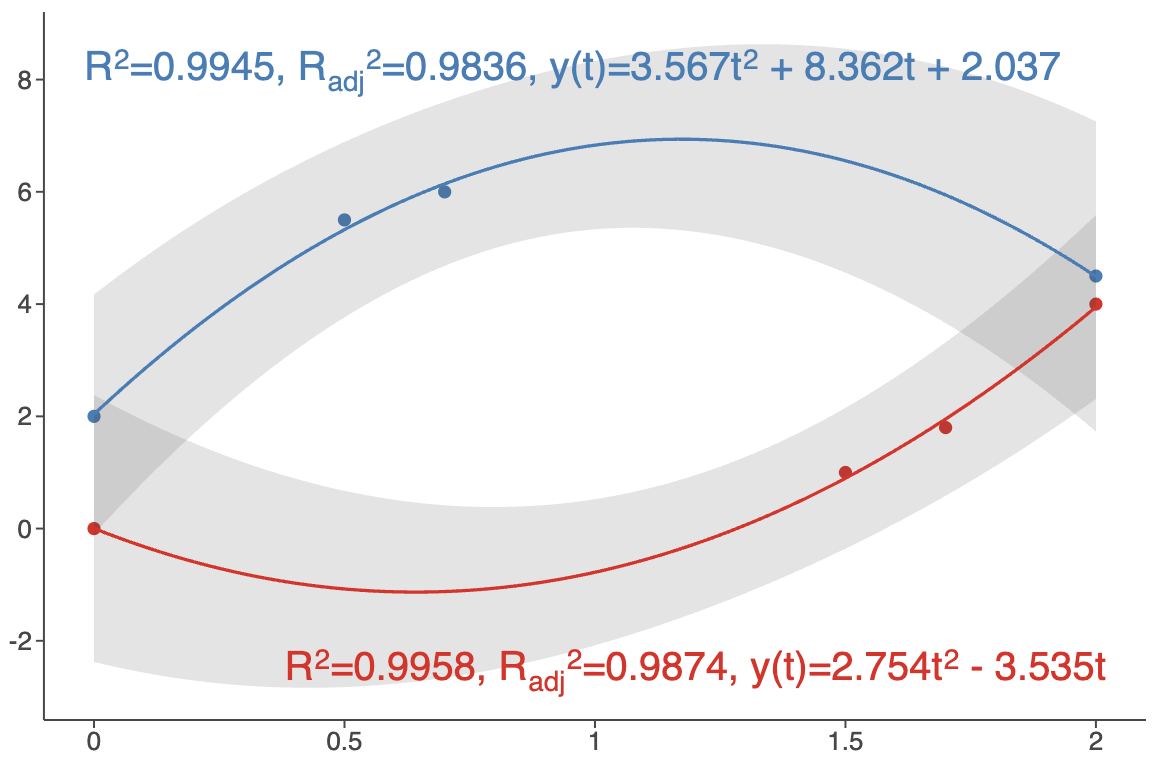
See example notebook.
-
Plot Tags
Plot tags are short labels attached to a plot.

See example notebook.
-
New
geom_bracket()andgeom_bracket_dodge()GeometriesNew geometries designed primarily for significance bars (p-values) annotations in categorical plots.
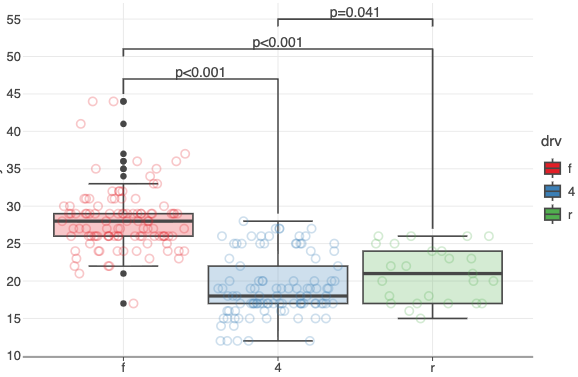
See: example notebook.
-
Custom Color Palettes in
geom_imshow()The
cmapparameter now allows you to specify a list of hex color codes for visualizing grayscale images.
Also, the newcguideparameter lets you customize the colorbar for grayscale images.
See example notebook.
-
New
palette()Method in Color ScalesGenerates a list of hex color codes that can be used with
scale_color_manual()to maintain consistent colors across multiple plots.See: example notebook.
-
New
overflowparameter inscale_color_brewer(),scale_fill_brewer()Controls how colors are generated when more colors are needed than the palette provides.
Options:'interpolate'('i'),'cycle'('c'),'generate'('g').See: example notebook.
-
New
break_widthParameter in Positional ScalesSpecifies a fixed distance between axis breaks.
See examples:
-
Axis Minor Ticks Customization
The
axis_minor_ticksandaxis_minor_ticks_lengthparameters intheme().See: example notebook.
-
Pan/Zoom in
gggrid()with Shared AxesPan/Zoom now propagates across subplots with shared axes (
sharex/sharey).See: example notebook.
-
And More
See CHANGELOG.md for a full list of changes.
Recent Updates in the Gallery


This project and the corresponding community are governed by the JetBrains Open Source and Community Code of Conduct. Please make sure you read it.
Code and documentation released under the MIT license. Copyright © 2019-2025, JetBrains s.r.o.